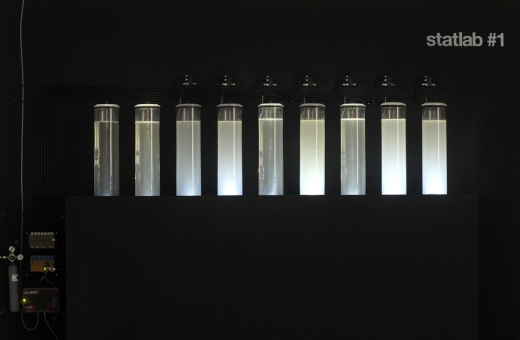
Statlab by Tjerk Stoop is an environmental art project, creating an analog visualization of air quality. From Stoop’s website, “It displays the daily average of CO2 concentration trough a chemical reaction where chalk particles are formed. The result is an analogue graph where the difference in the amount of chalk particles per tank is a global measure for the fluctuating CO2 concentration within one week.” Great to see physical/analog visualization presenting important data in a clear manner (well, assuming you read the accompanying text).
[via]
